Tech/Skills
- Next.js (App Router)
- Upstash Redis
- Bradley-Terry ranking model
- Tailwind CSS
Summary
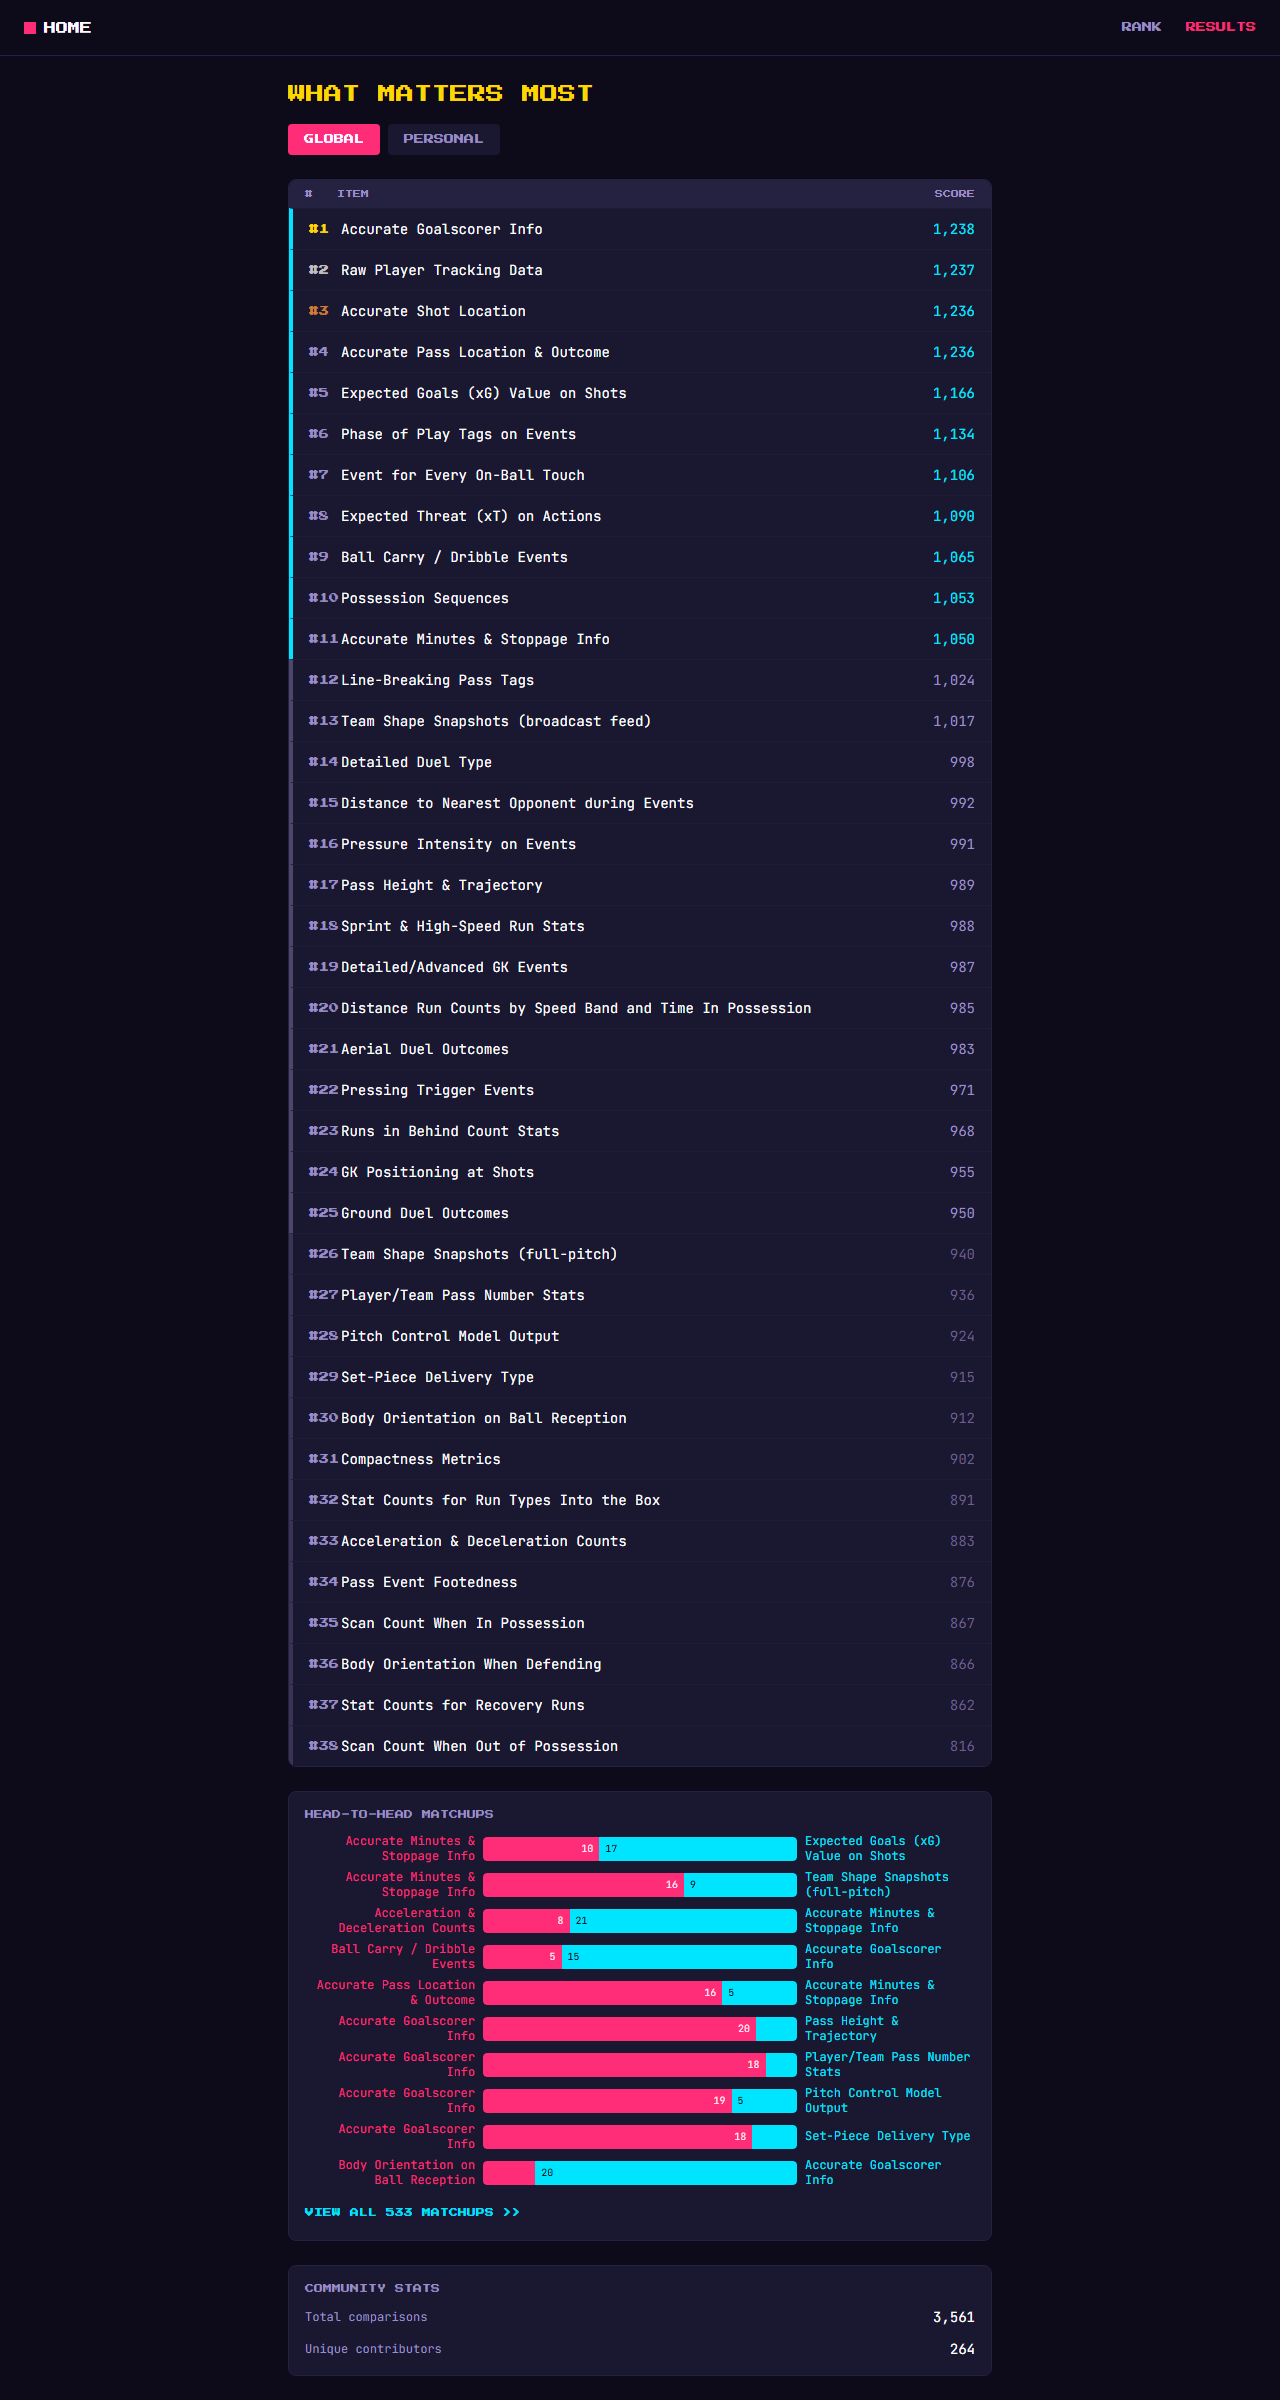
I wanted to test some assumptions about what features of data people thought were most important/valuable. Partly inspired by comparative judgement, I decided to create a fun game where people could make a choice between two different types of data as to which they found more valuable.
This was a fun project, primarily put together using Claude Code, which was also a first-time for me working with Redis and implementing a ranking algorithm.
Learnings
'Game' design
It was important for me to try and get the choices and phrasing around the different kinds of data right. My instinct was that people would rate the newer or more 'powerful' forms of data as more valuable, but I know from day-job how vital it is for the 'simple' pieces of data to be reliable and complete.
While testing the game, I decided on two game-learning/helper mechanisms. The first was that each user was given a test go before their first set of ratings, as I thought that it would let them get used to the actual choices without it affecting the real scores. As a second (and a bit of a firmer steer), they were asked 'are you sure' if they ever picked against 'Accurate Goalscorer Information' in one of their choices.
I also decided to let users make choices in batches of ten, lightly encouraging them to do another batch, an attempt at lightly game-ifying the data collection.
Storing the scores
I knew that I wanted to gather a 'global' set of data, but also to show the user their own rankings. I also decided to collect and show the data about head-to-head choices between indvidual categories.
Conversing/researching with Claude Code led me to using Upstash Redis based on ease and cost (the website's use case was in the free tier limits). There were nested hashes for the data, firstly by the general category (global/user battle scores, global/user rankings), with the second key level being the actual items (an item1:item2 combination for the head-to-head category battle counts).
This also allowed me to keep a tally count of the number of rankings and unique users, which was a nice bonus. Users were given a unique UUID per-browser, stored in localStorage on their first visit to the site (technically allowing them to return and do more rankings if they wanted).
Visual design
I wanted the game to feel engaging and fun, considering the topic was quite niche, nerdy, and in many cases actually required some serious thinking about the choices.
Claude Code already had a preference to 'dark mode with a not-unpleasant vibrant accent colour' styling, but I steered it towards an 8-bit style.
Deeper dive
It was a very interesting experience to release the game to the public -- primarily via my 'Get Goalside' football analytics newsletter and LinkedIn -- and see the global rankings update.
Some choices of 'the crowd' surprised me, although I also suspect that I could have designed the introduction to the game and the ranking algorithm itself slightly better. (Given that this was just a side project, though, I think I did a decent job).
The basic idea ('what data features do people place value in') would have been much worse without the introduction to comparative judgement at the 2025 Field of Play conference, and without my journalistic and data backgrounds which have given me an interest in polling. It's clear to me from having paid attention to a fair amount of polling data over the years that the way questions are positioned to respondents is very important. (Of course, 'Yes, Prime Minister' also demonstrated this in its own way). The former made it clear to me that the format of 'this or that' would work much better than asking people to, for example, rate data categories out of 10; while the latter focused my mind on the phrasing around the whole game.